Observation View
Overview
The Observer View in Babel represents a unique mode of application monitoring. In this mode, all requests appear as Traces. Each Trace is directly connected to its corresponding element and code, allowing you to examine the call process and the values of the code lines. The Observer View offers a clear insight into your application's execution path, enabling you to inspect the result of each step. Moreover, once you've identified a problem and submitted the corrected code, you can also use the Trace to verify the accuracy of the latest code.
Quick Start
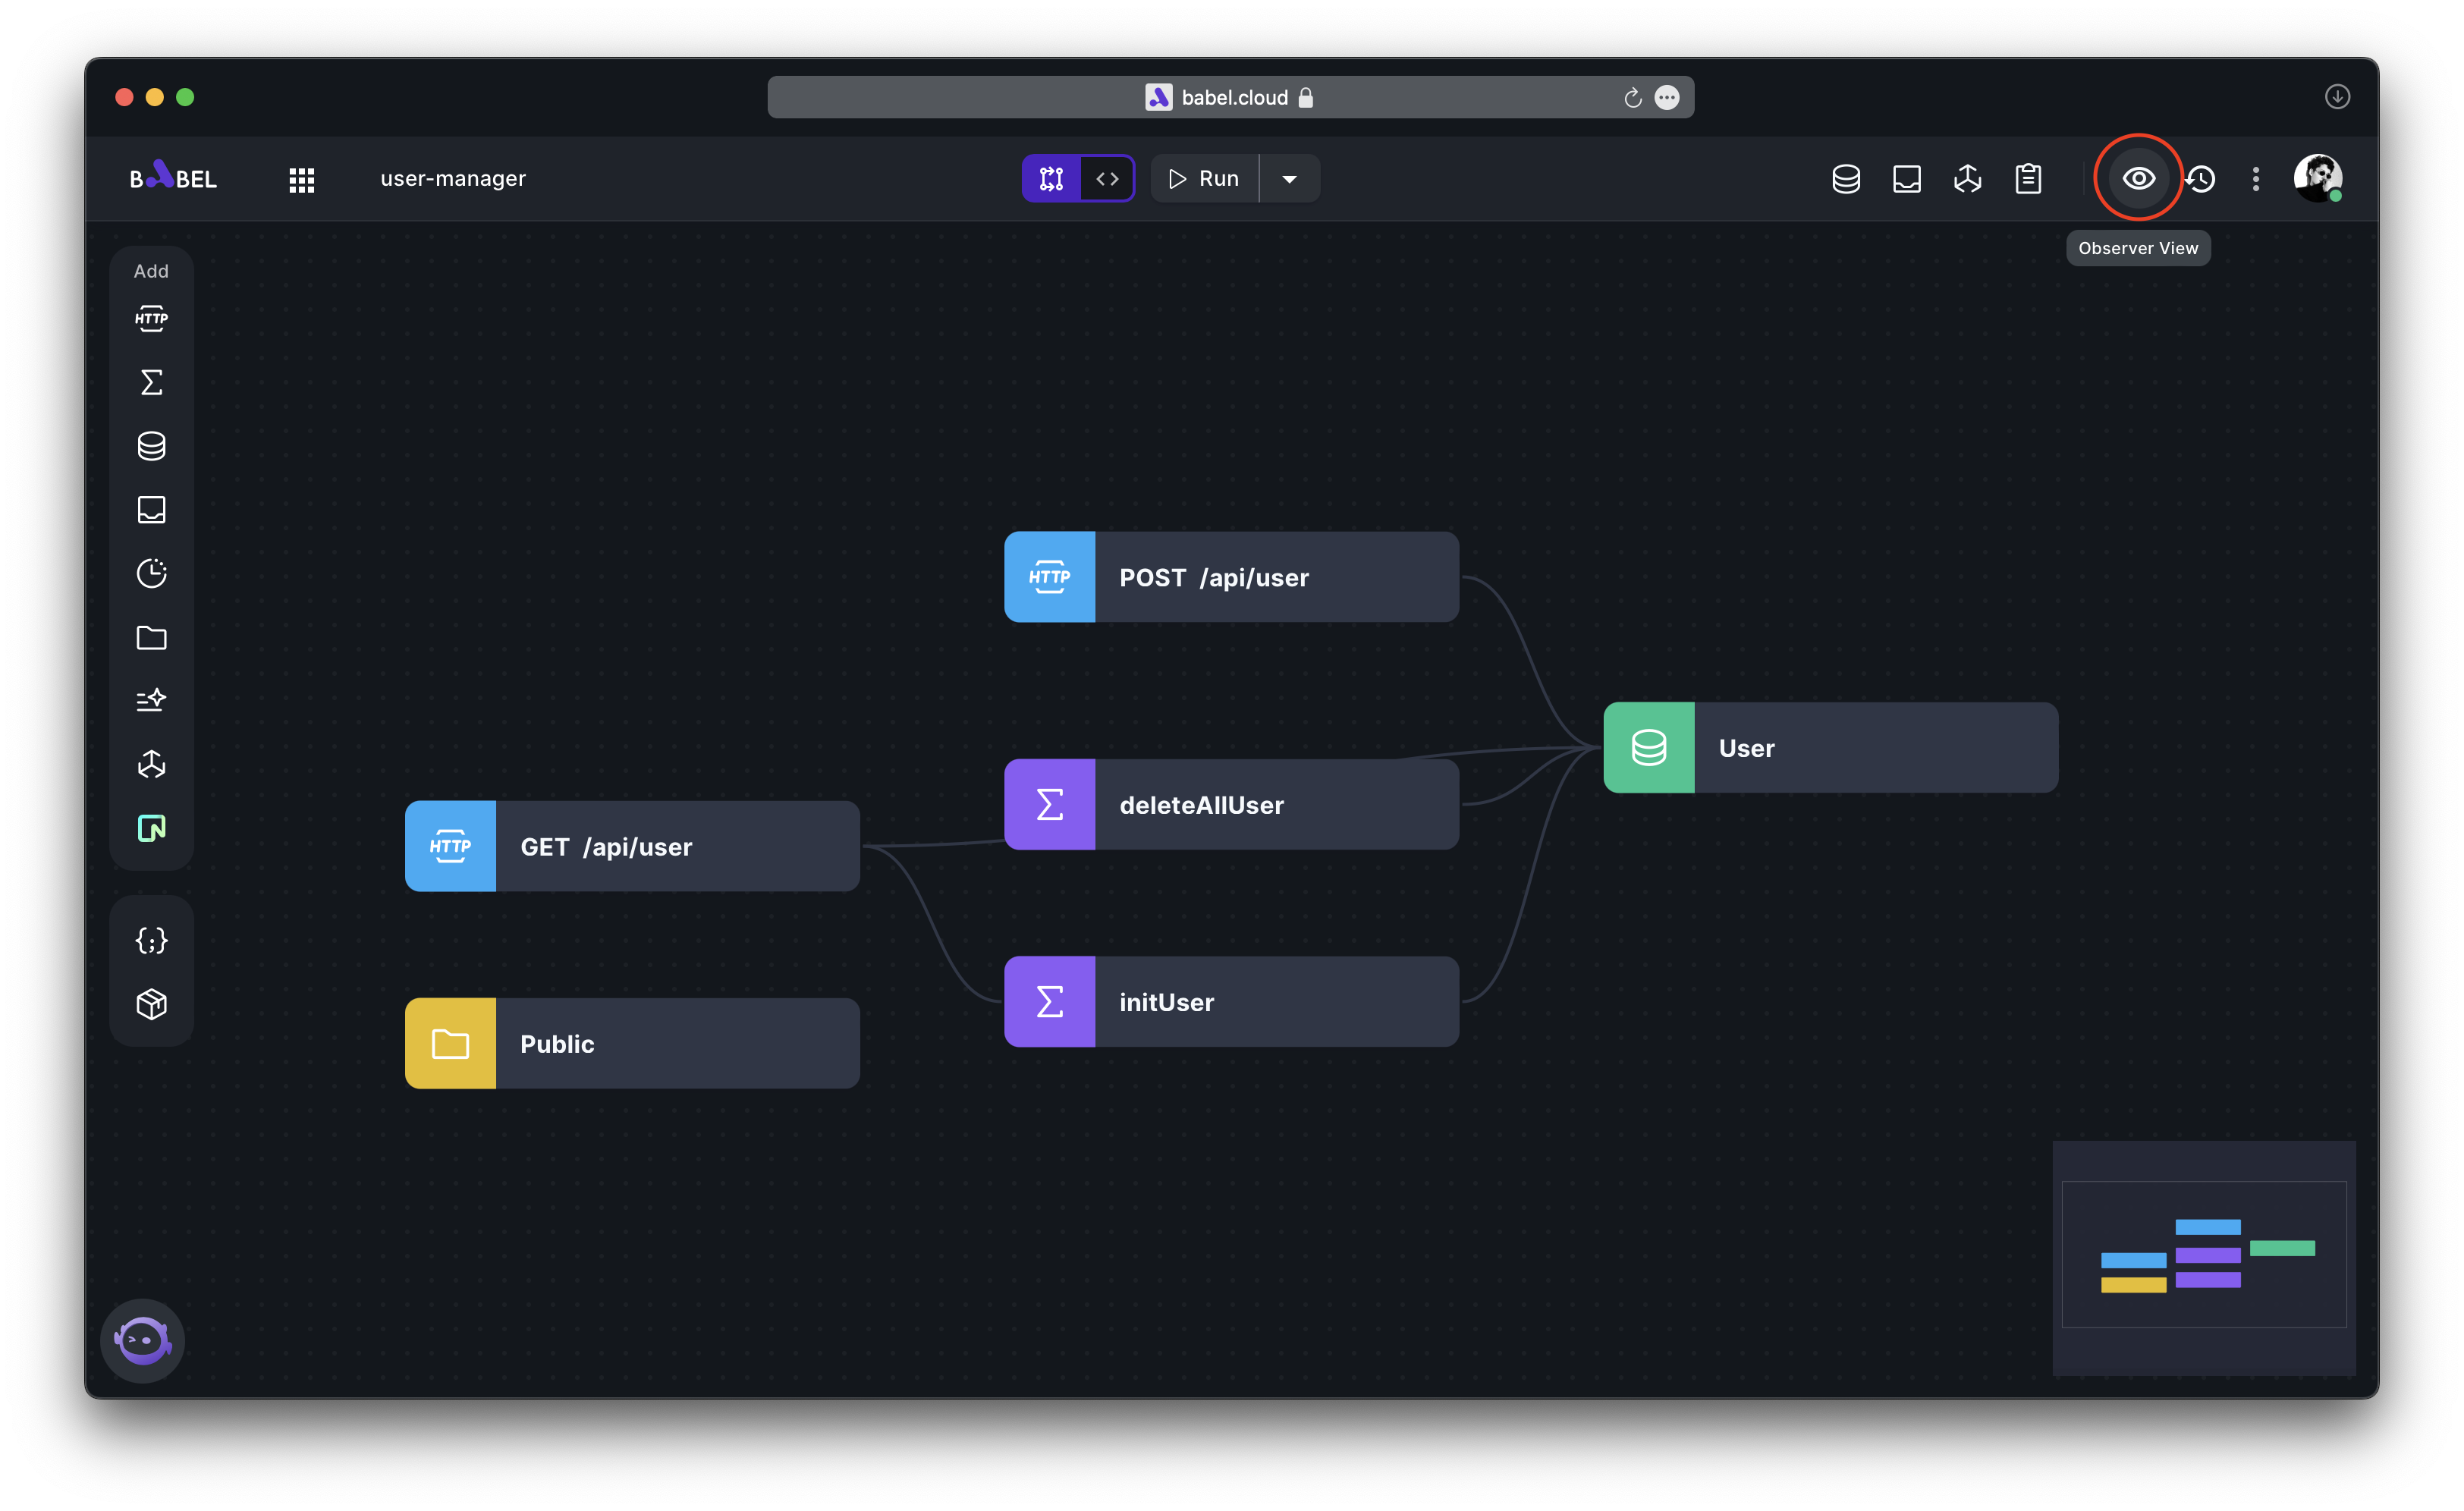
On the Workspace page, click the button as shown to enter the Observation View.
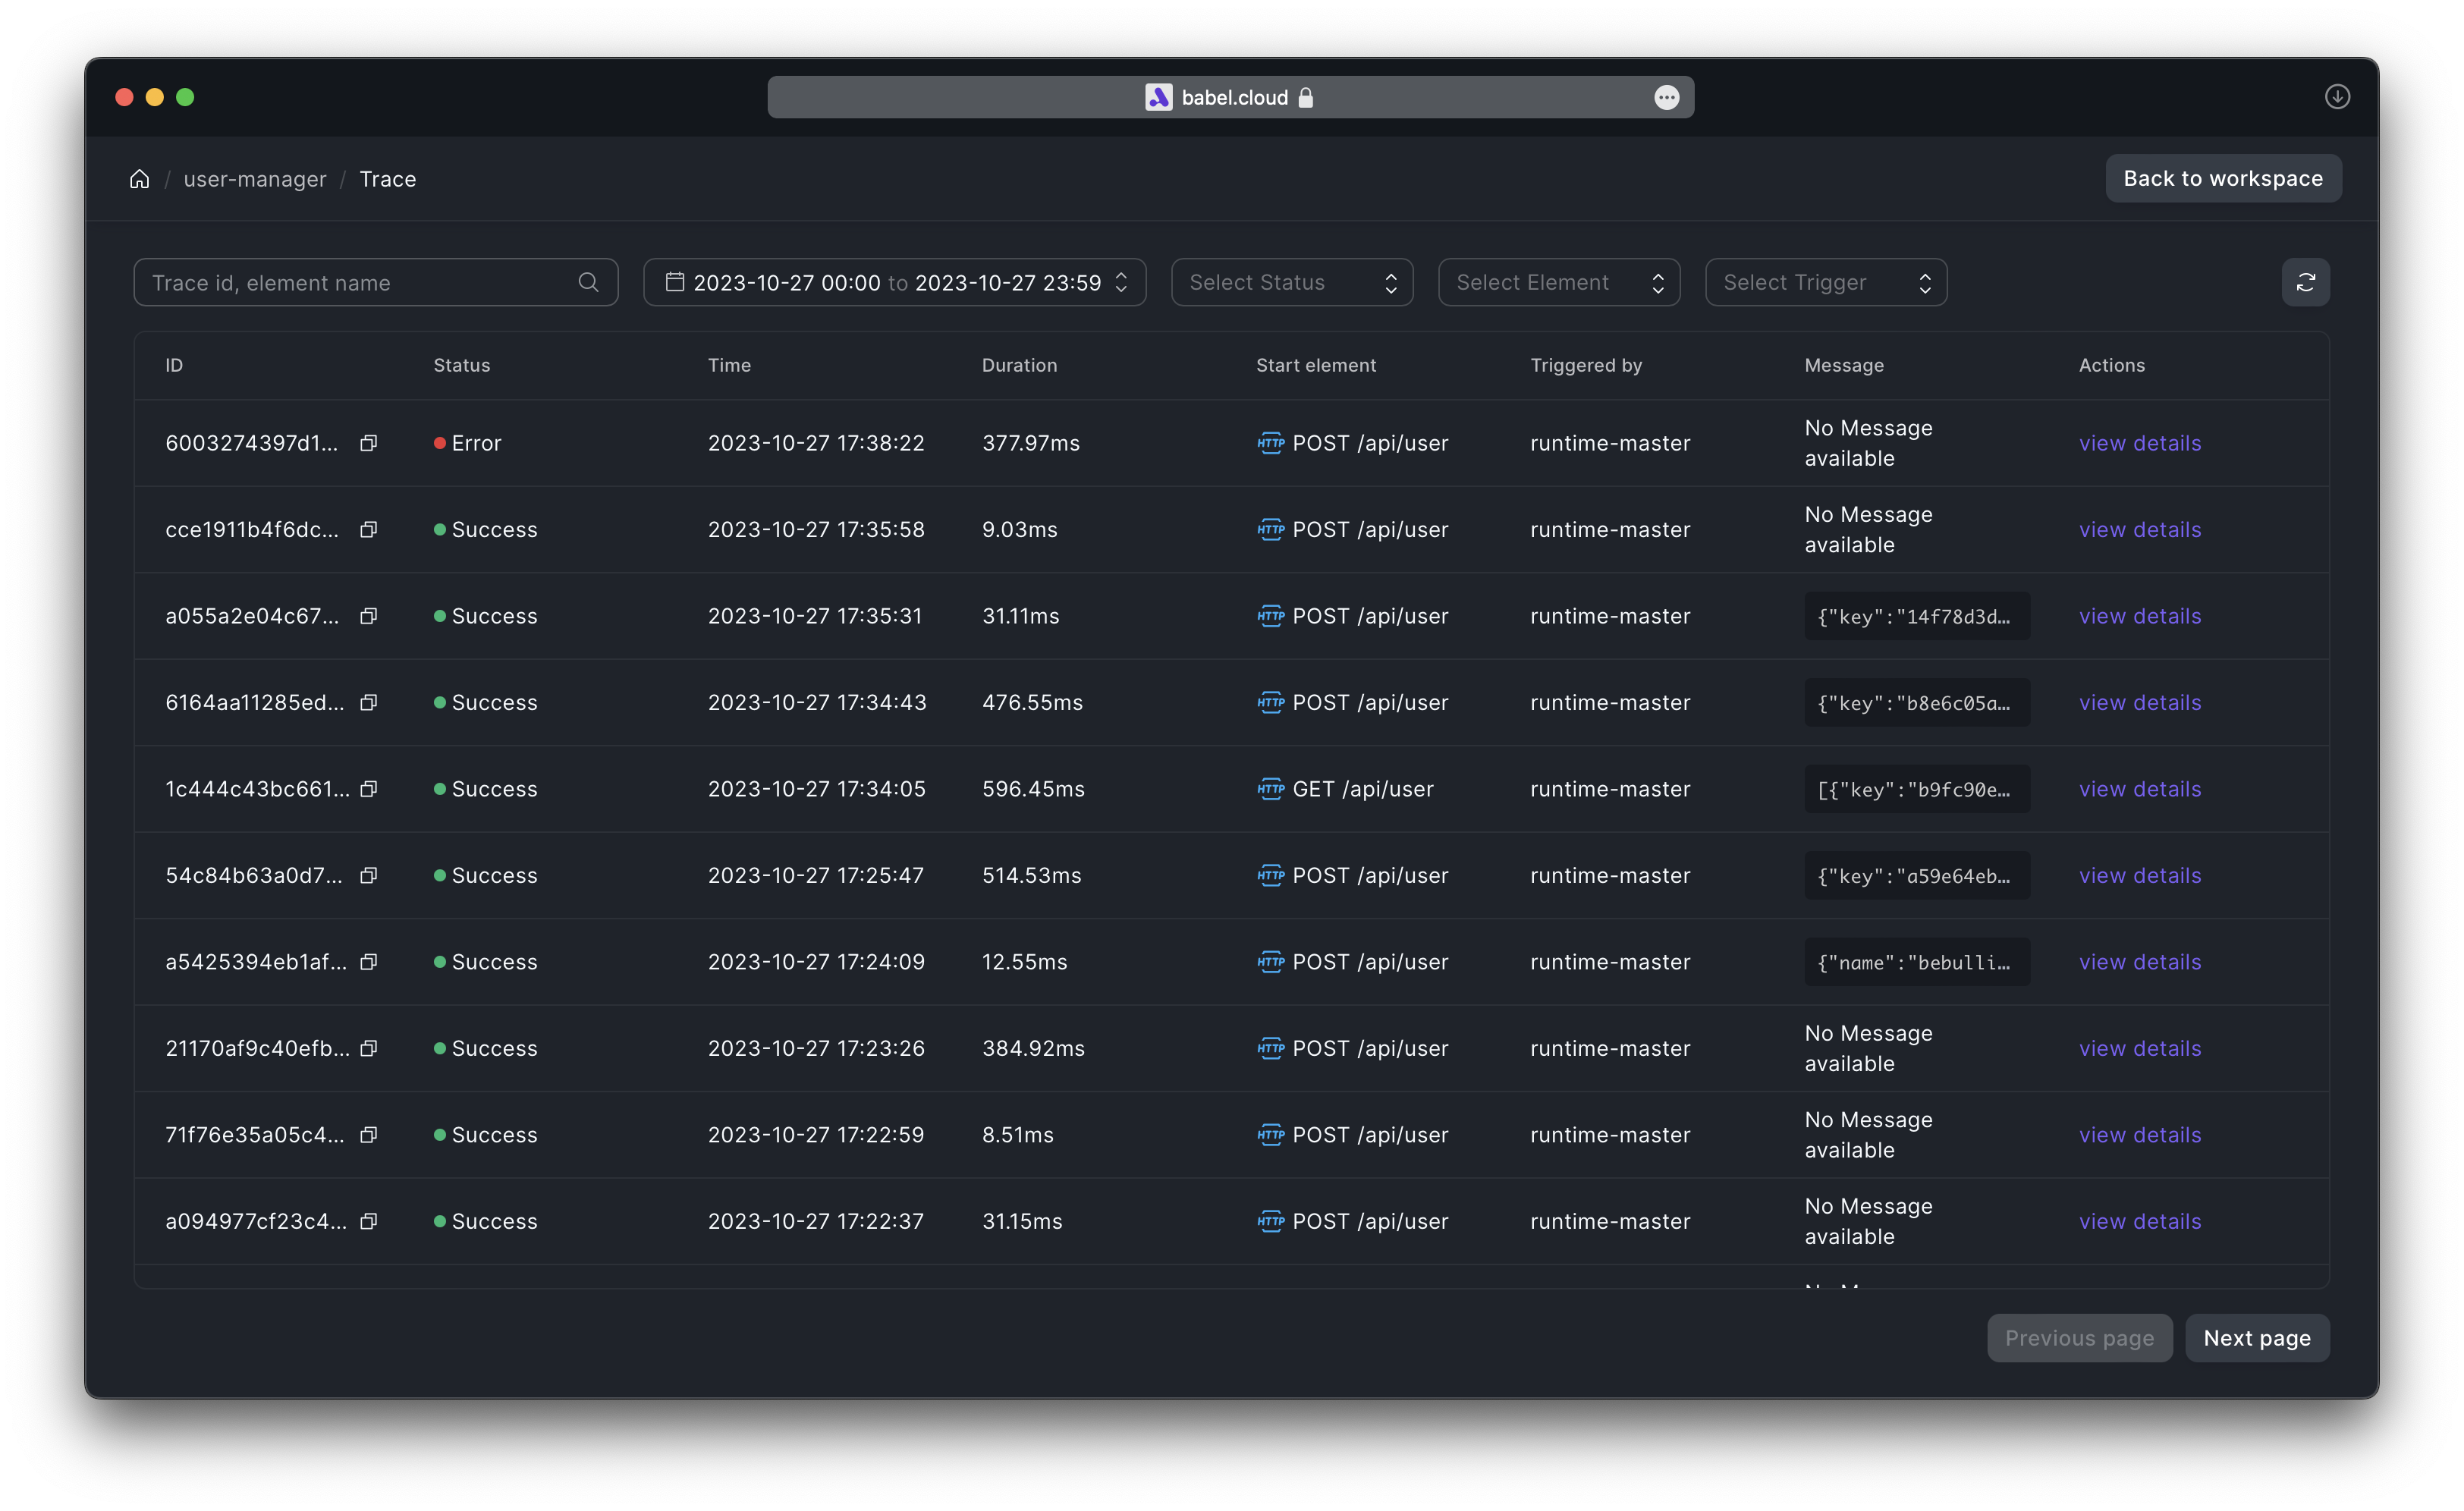
The Observation View logs the historical records of application requests and provides a query tool. You can filter requests according to your specific needs.
Clicking 'view details' restores the context of this request at that time. As shown in the figure, it displays which Elements the request has passed through, the request status code, and other information.
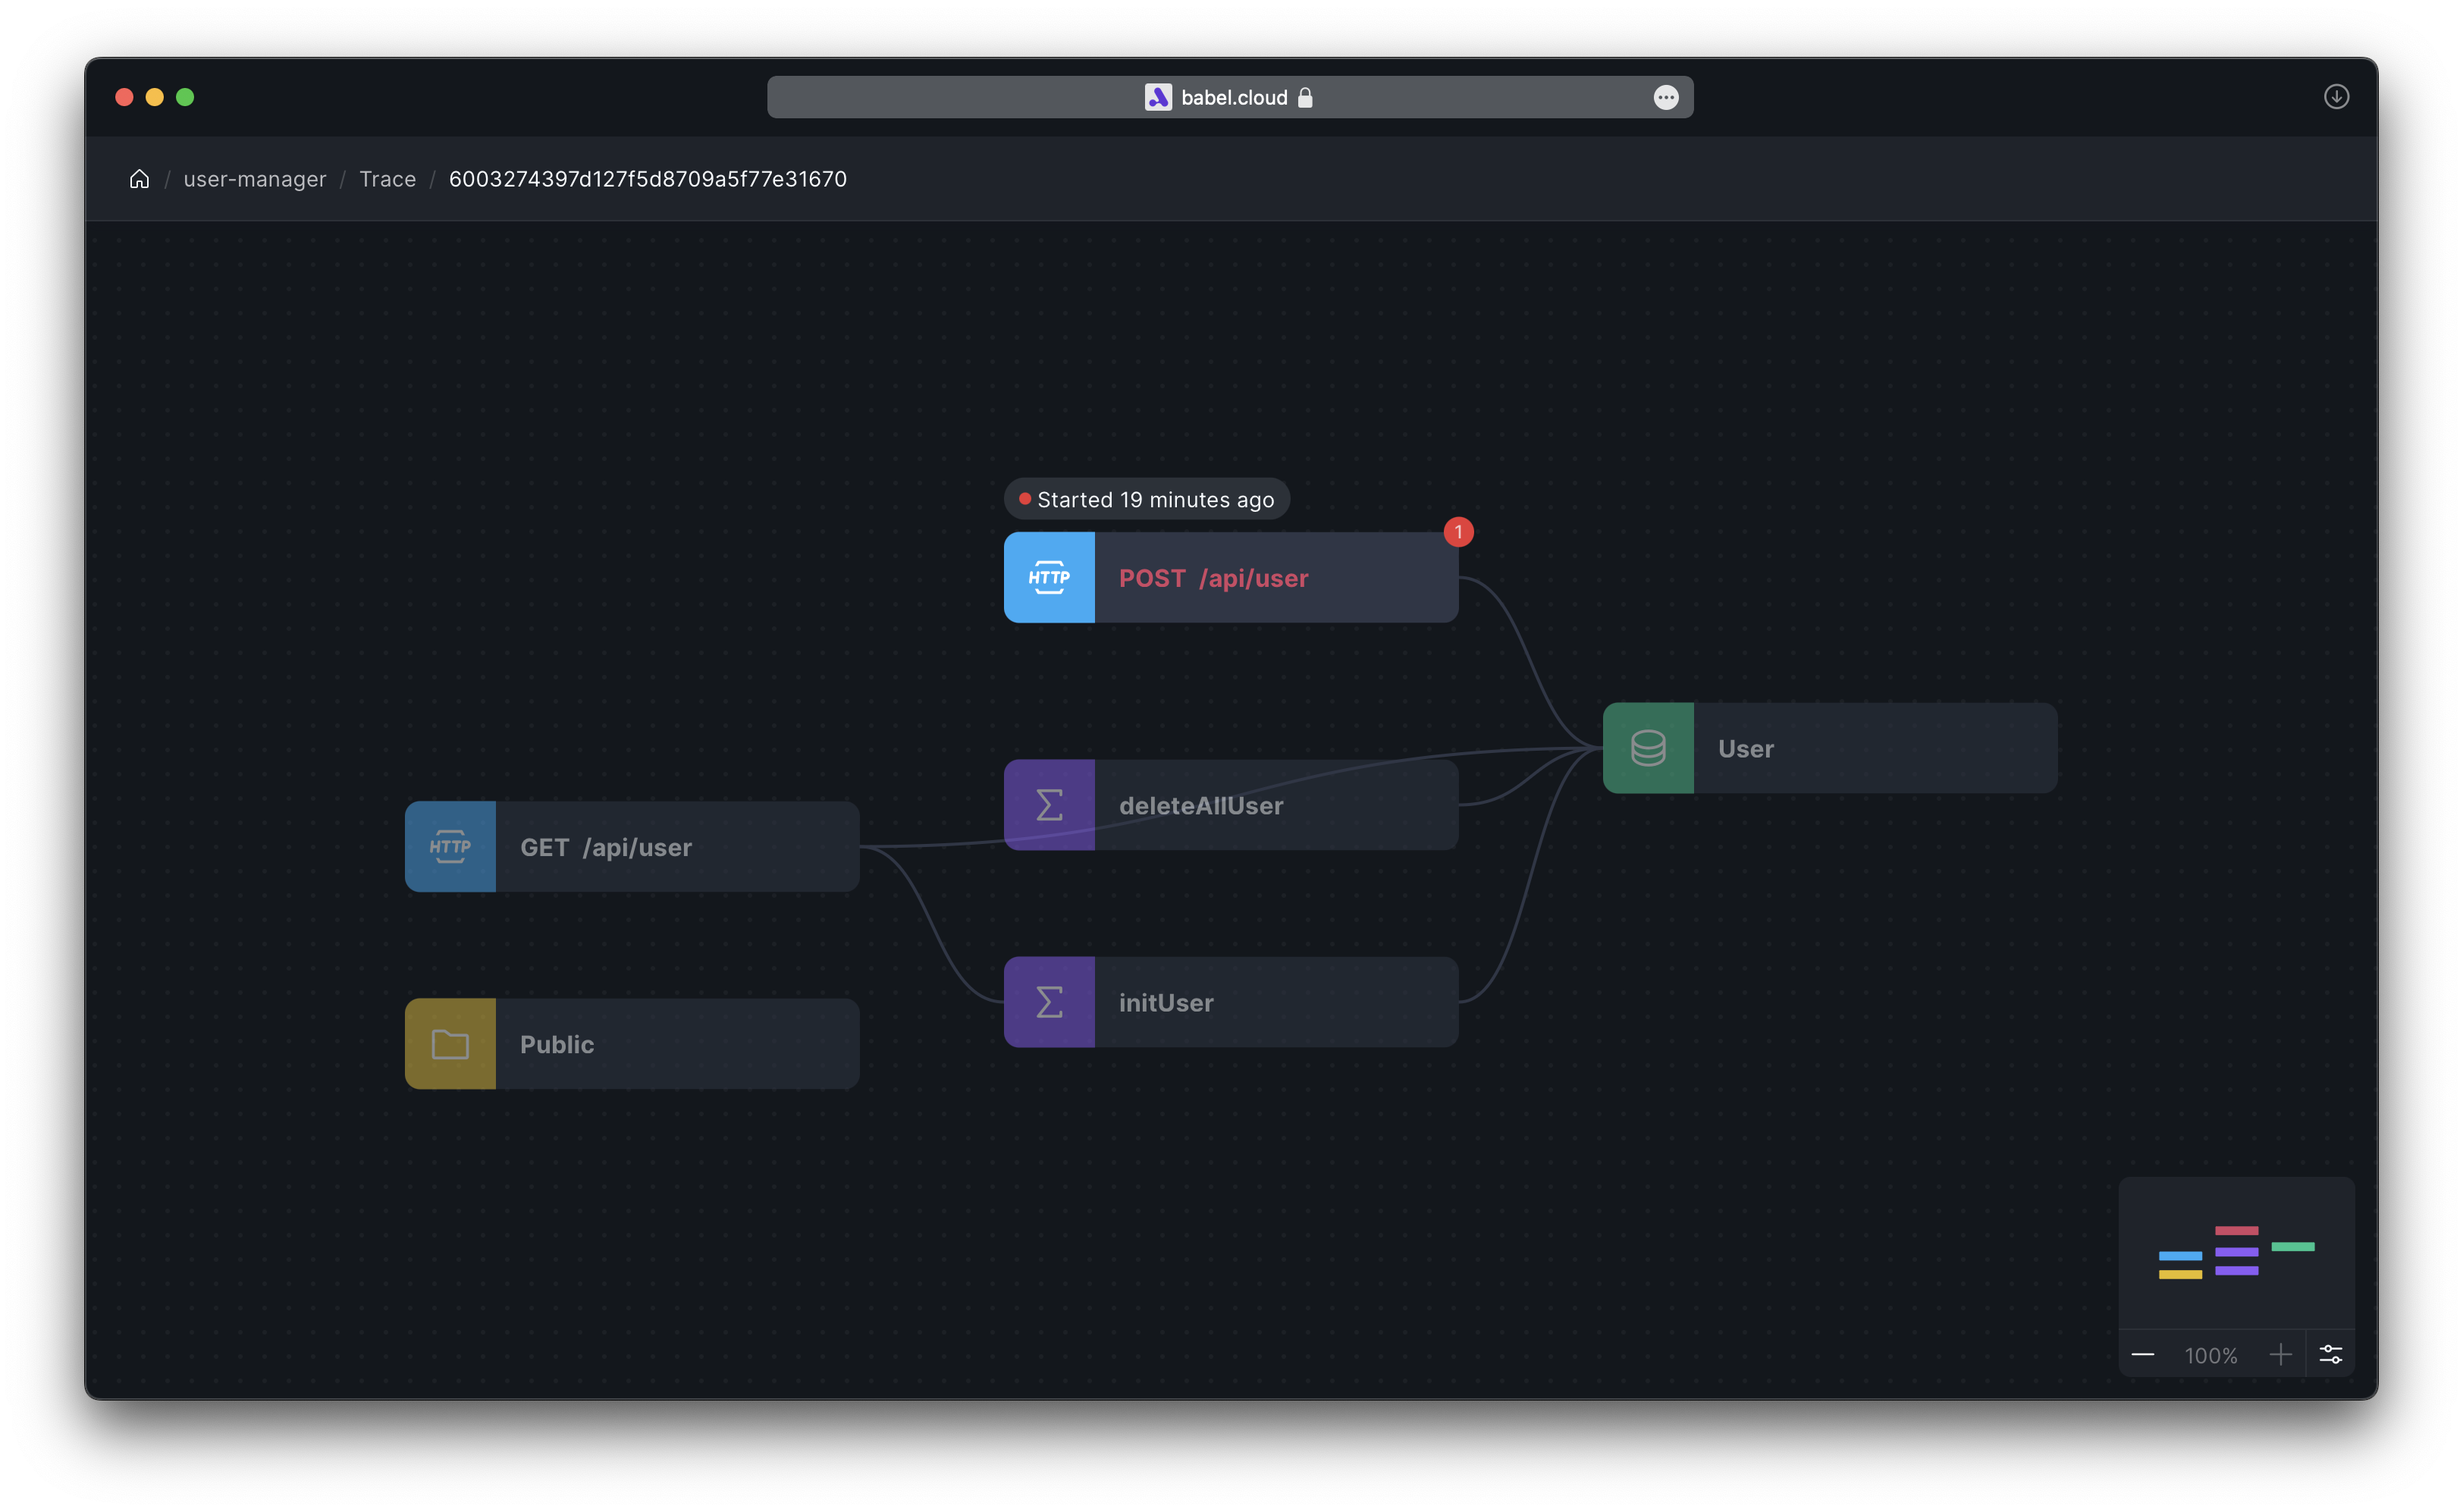
Clicking 'Started ... ' allows you to see the input parameters and response results, enabling the recreation of the fault scene, as shown in the figure below. This will assist in troubleshooting and pinpointing issues, and it is particularly effective for corner cases.
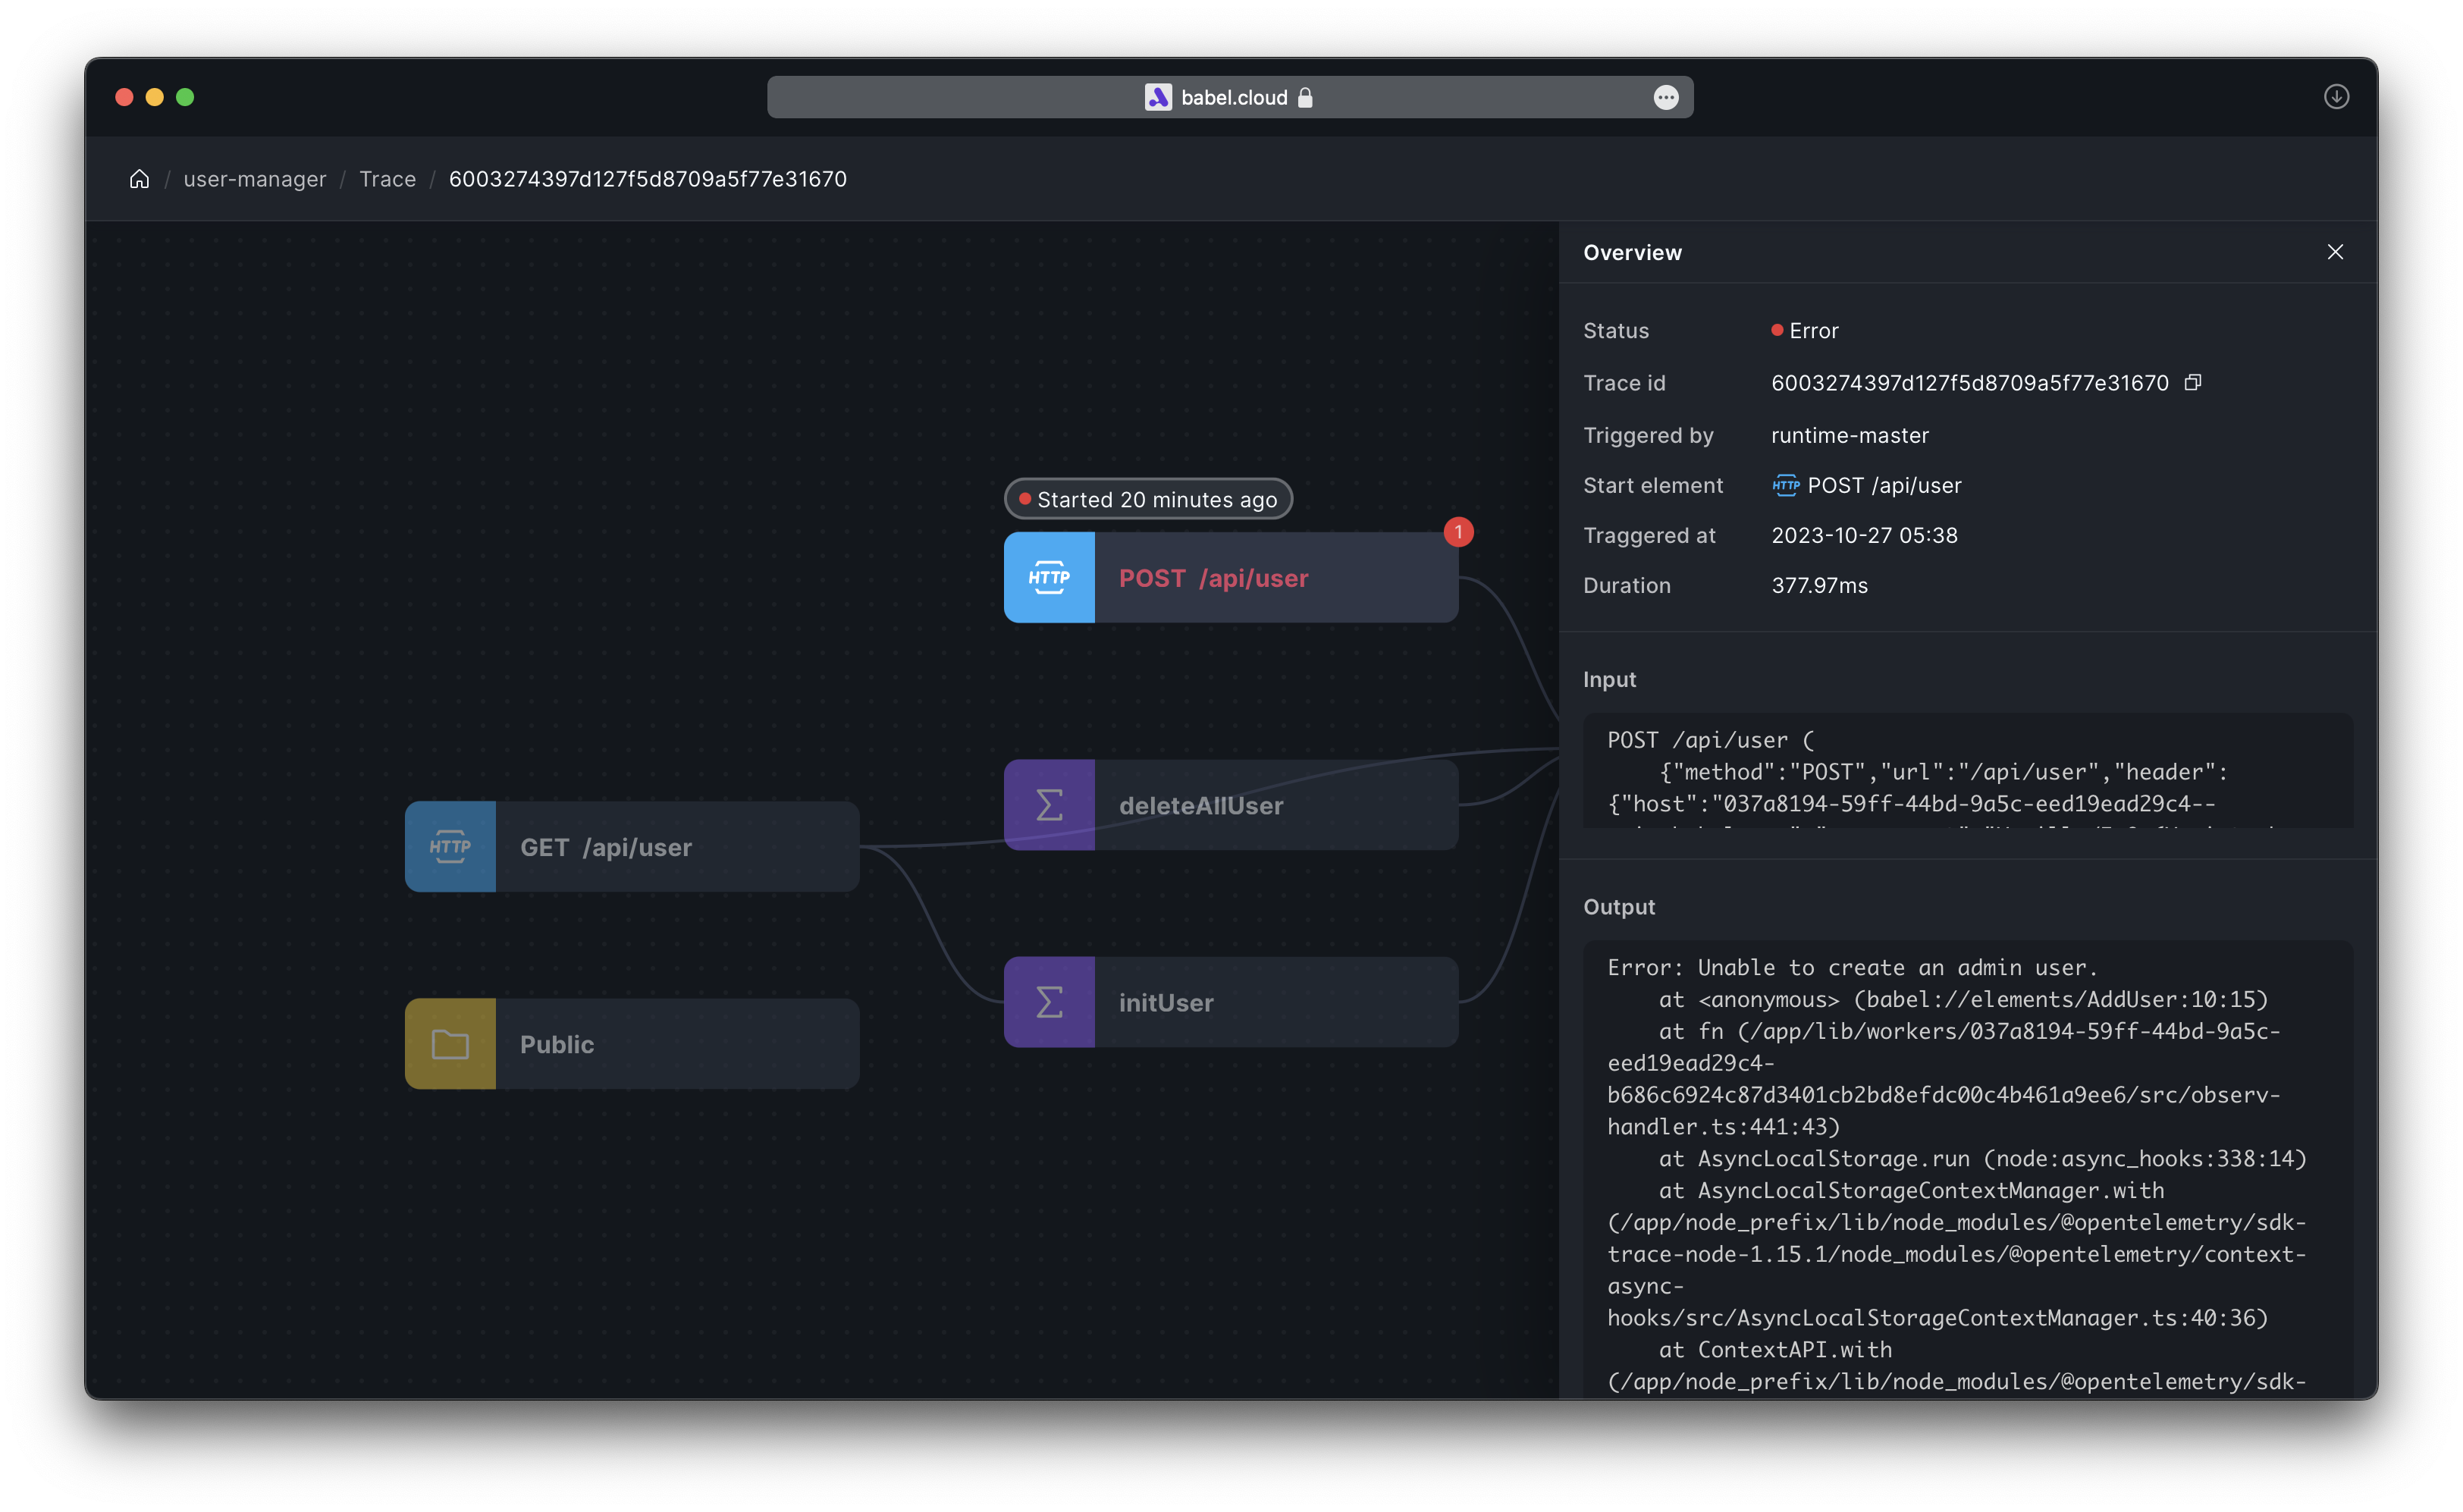
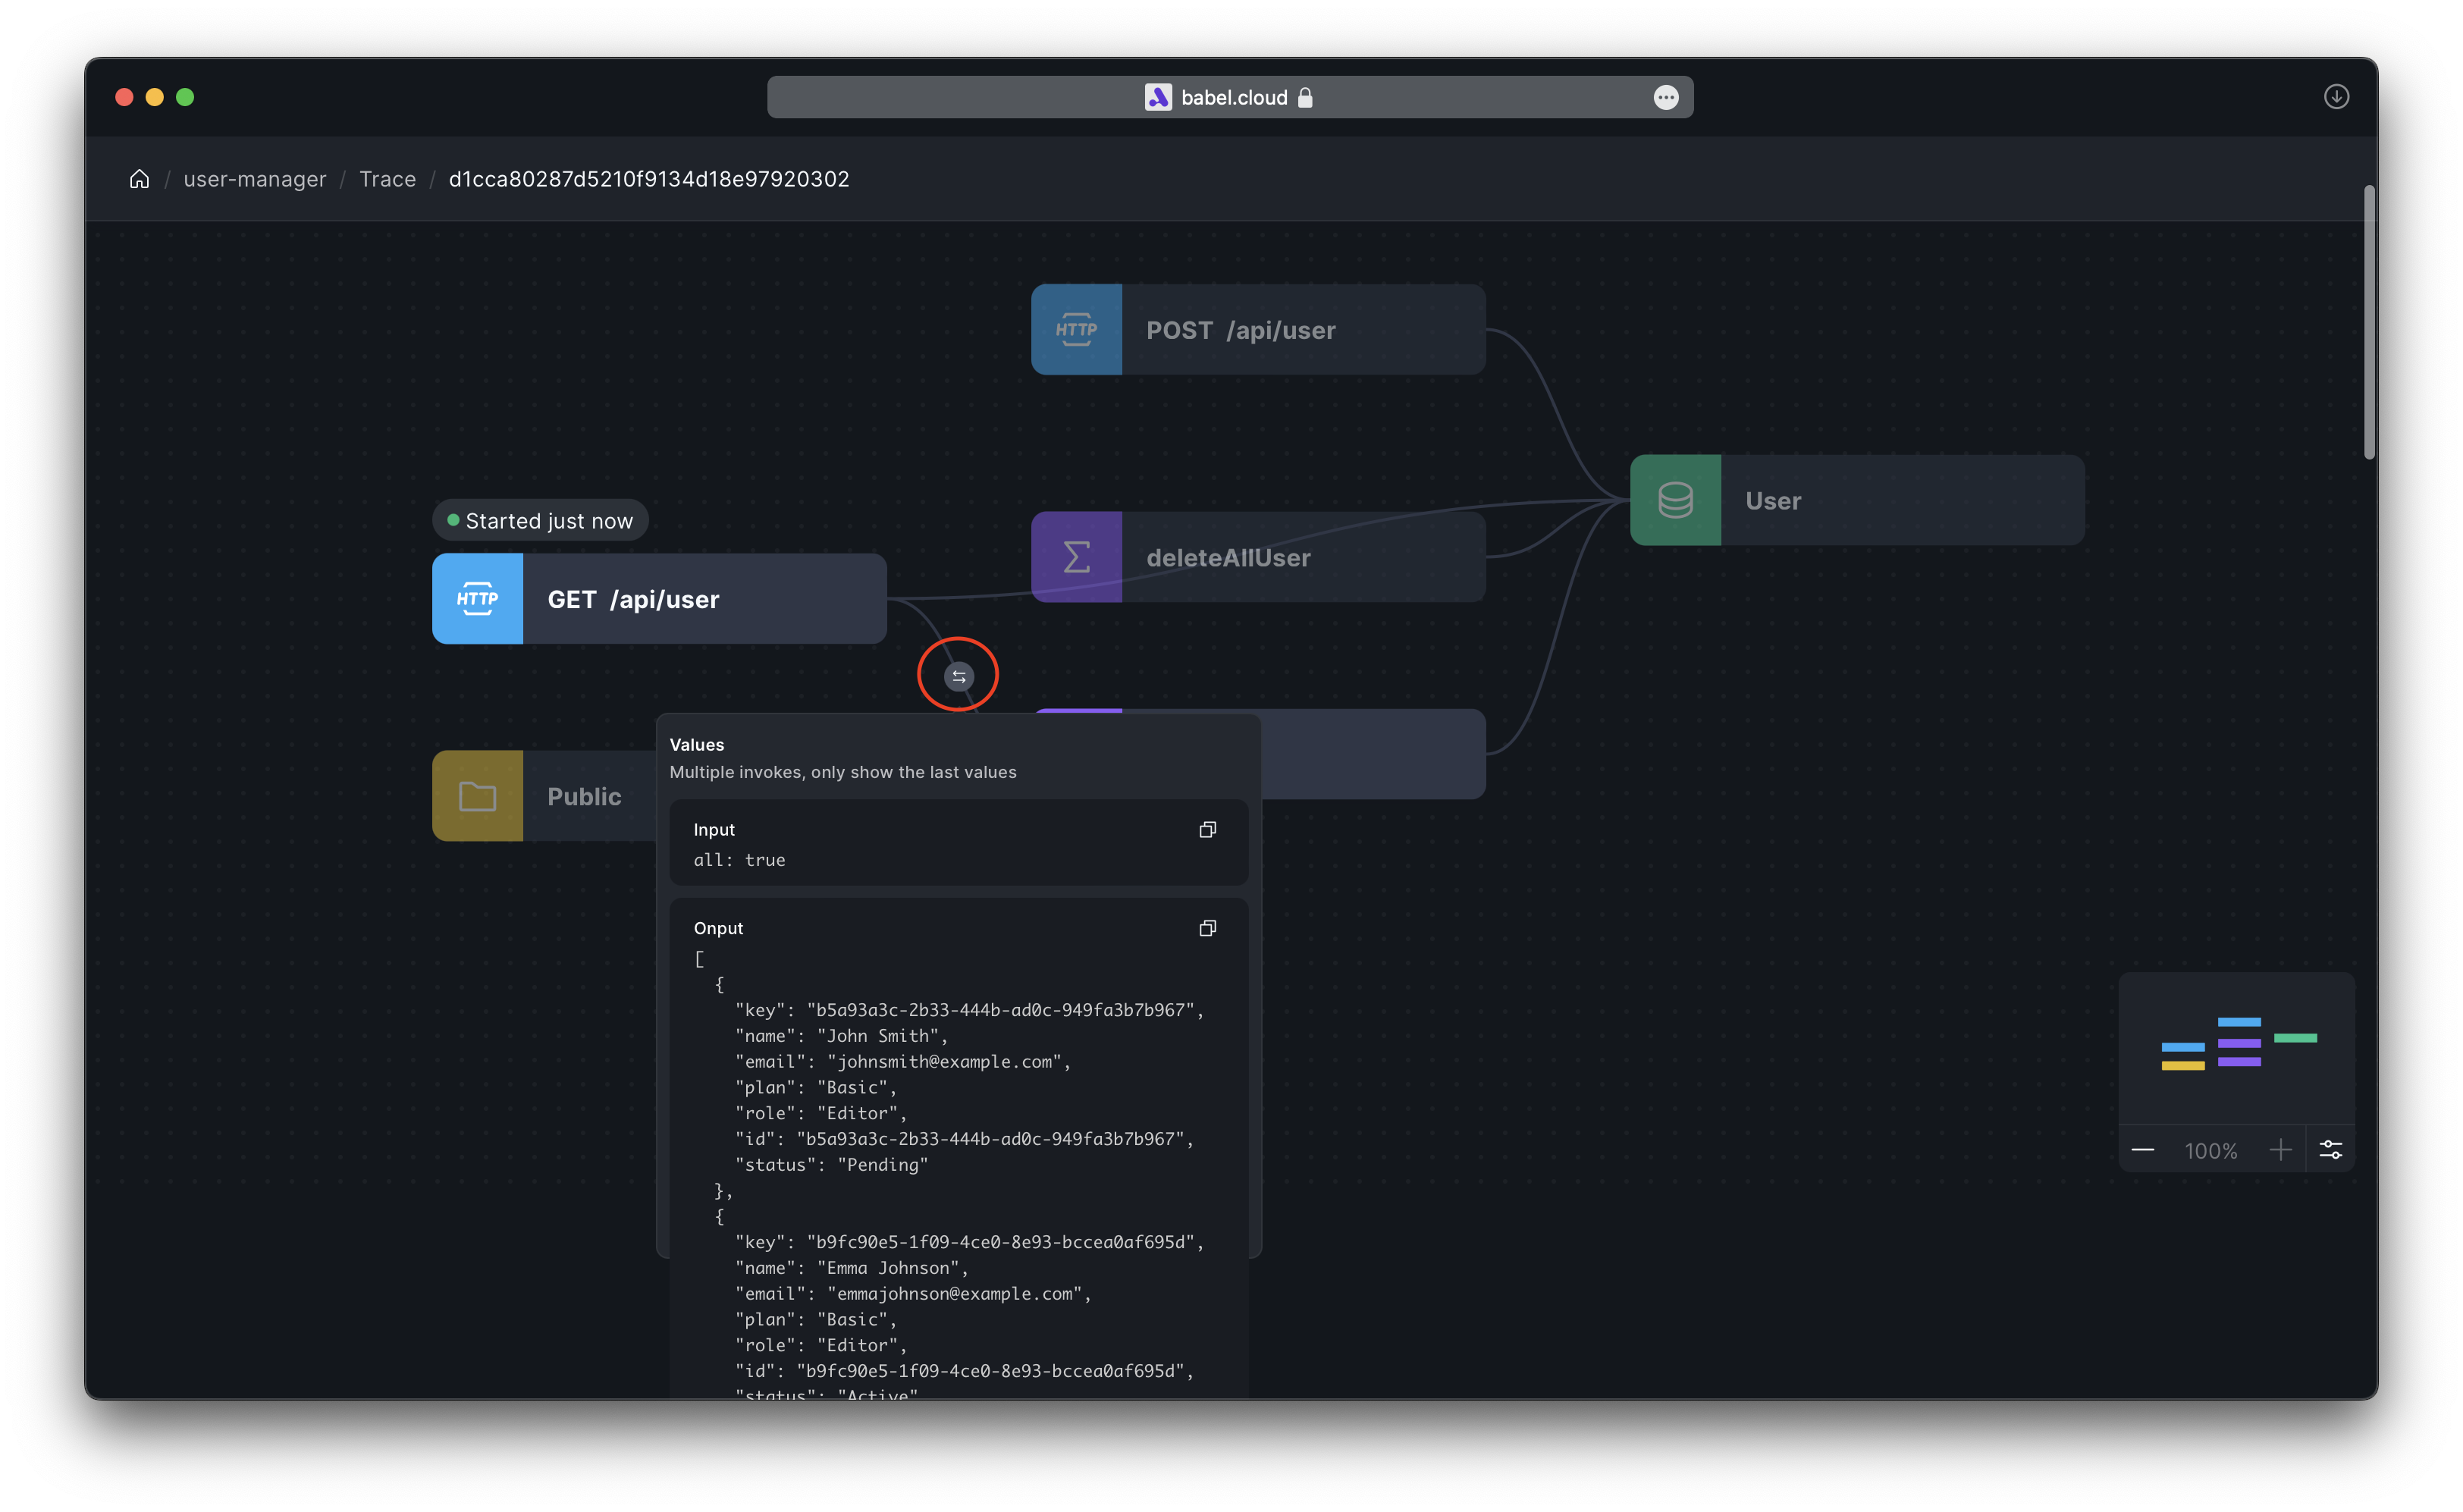
The Element marked in red indicates the exception in the current request. By clicking on the icon at the Element link, you can view the calling input parameters and response results.
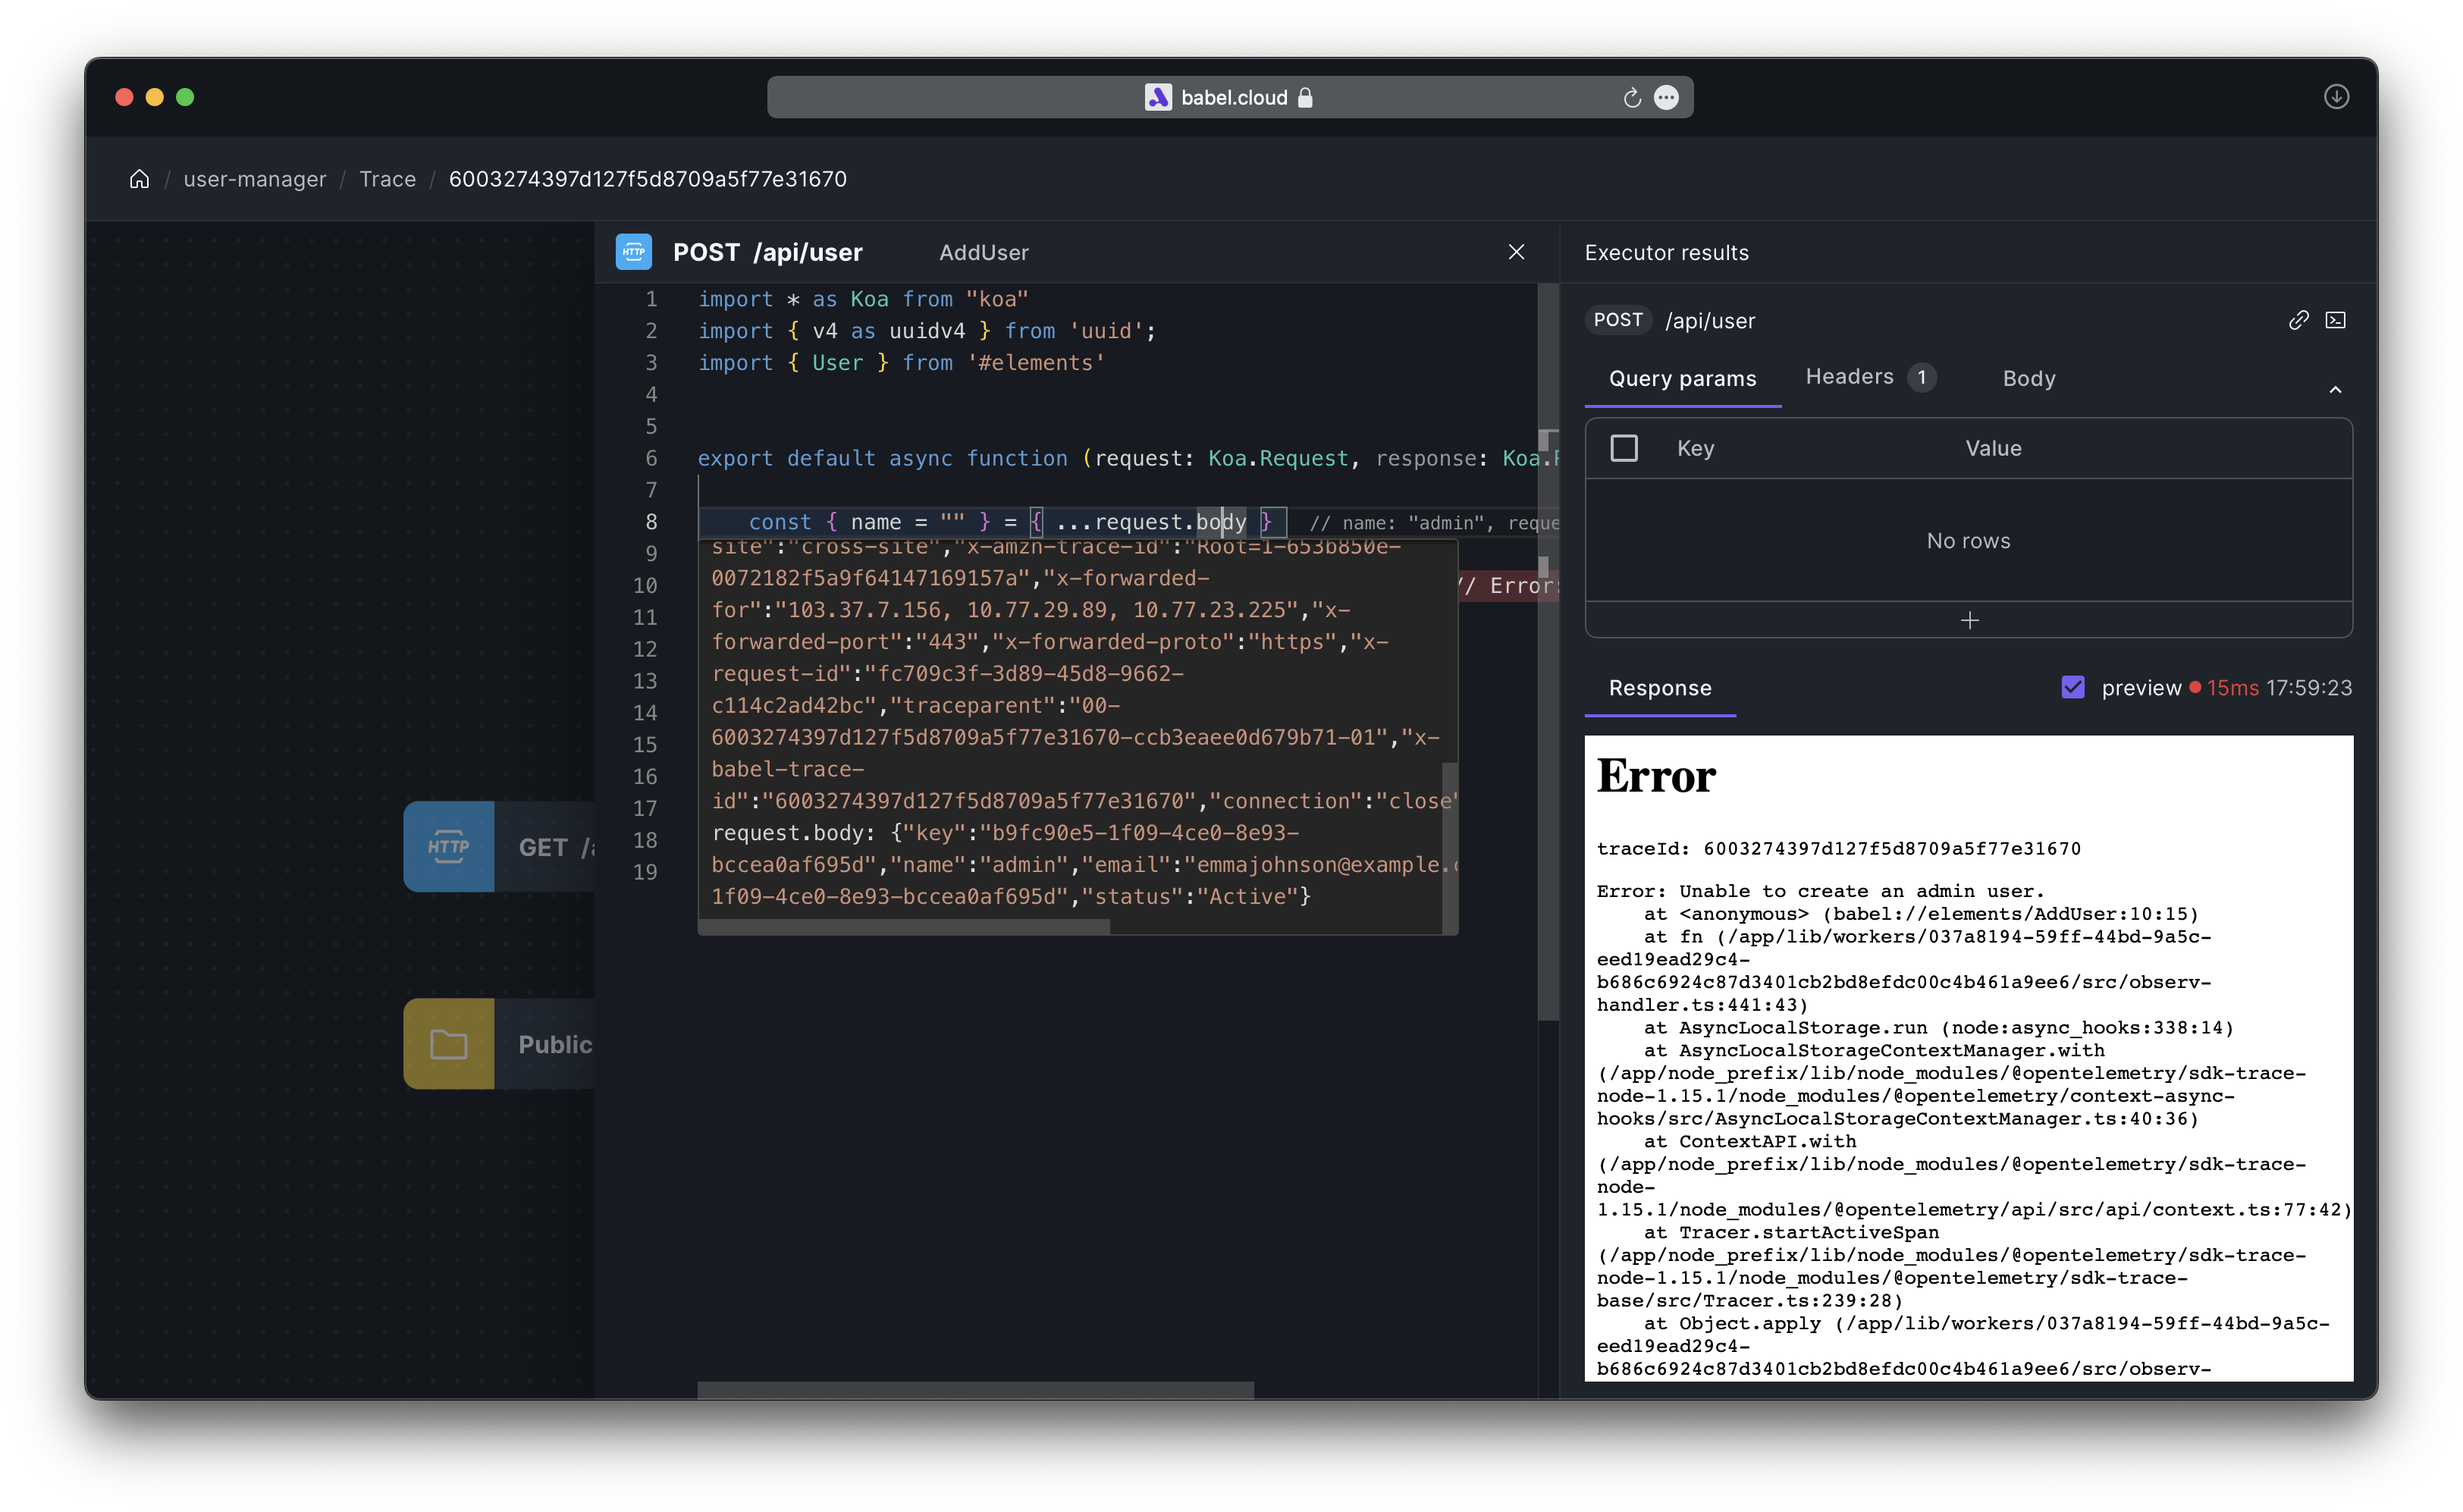
Clicking on the exceptional Element allows you to see the code version at the time of the request and the value of each line of code. This is immensely helpful in recreating the fault scene and pinpointing the cause of the fault.
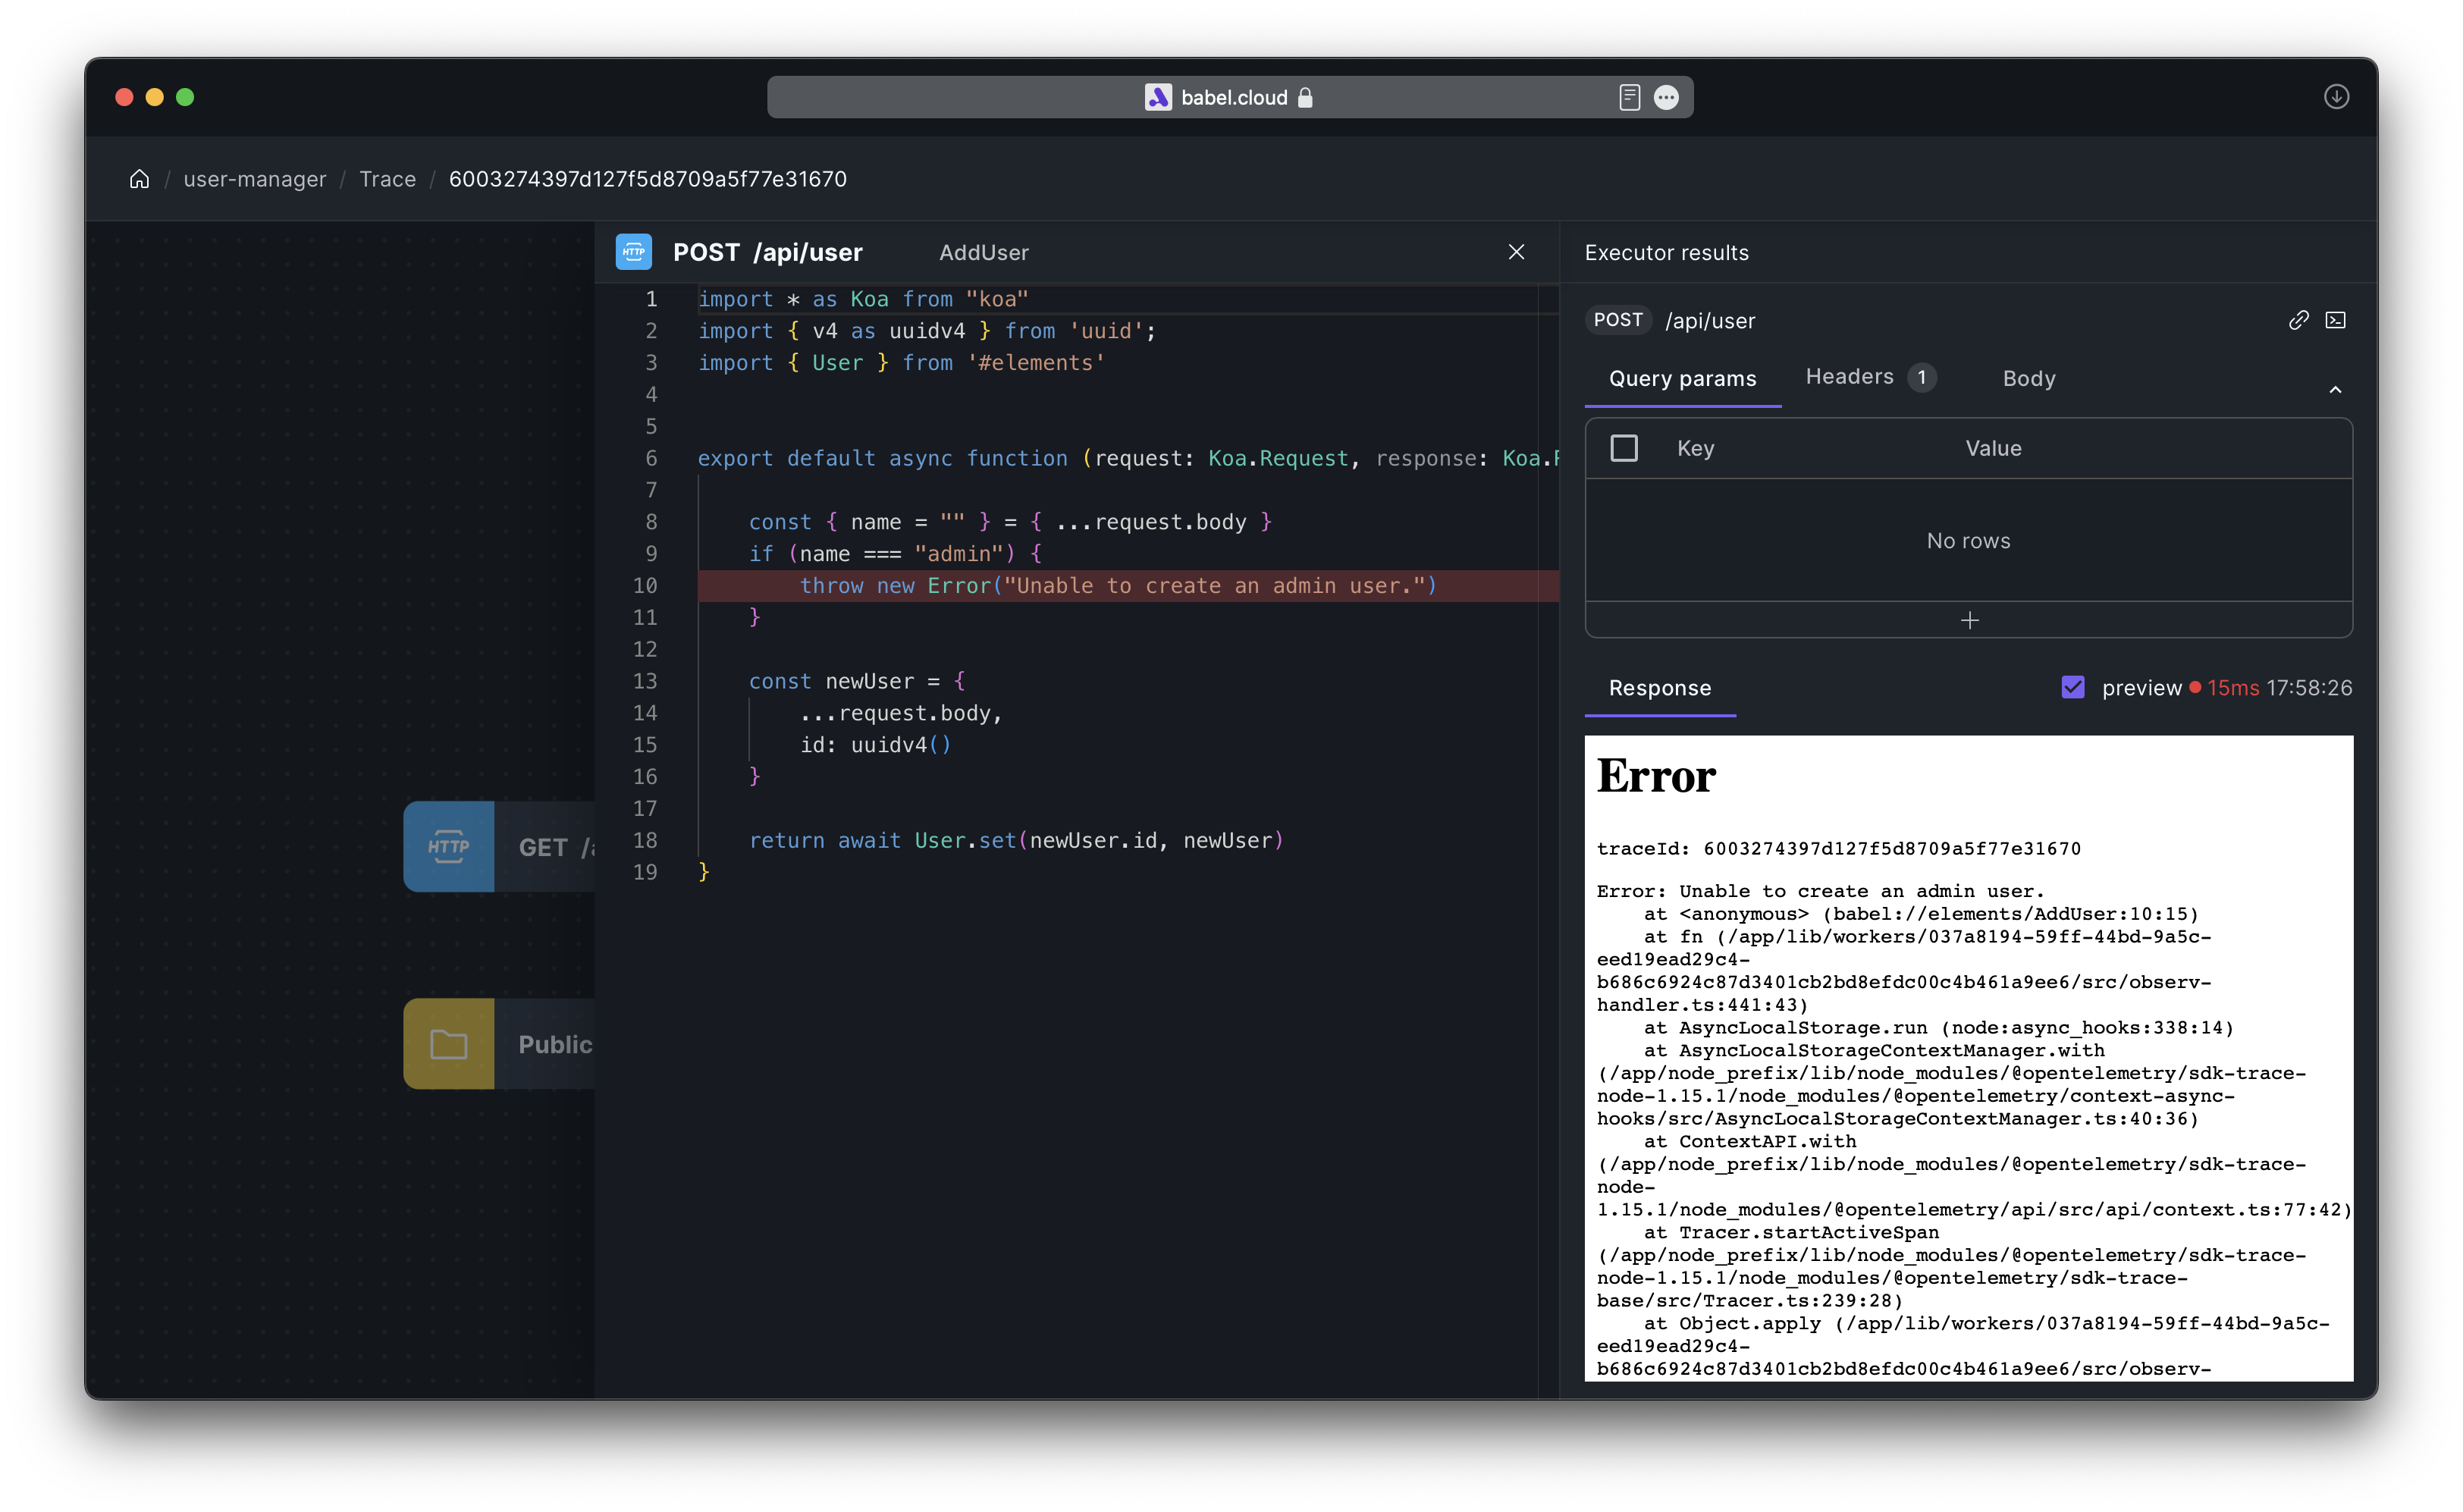
The line highlighted with a red background in the image is the code that led to the exception. The value of each line is displayed at the end of the line. For values of lines with complex structures, they can be displayed by hovering over the value.